Examining the weakest part of Washington’s unexpectedly strong game: Part 1 of 4
The first year of the Commanders’ rebuild under new leadership was an unprecedented success. By my estimation, it was the most dramatic one-season turnaround of a team’s fortunes in the salary cap era. And that was as far back as I looked.
The team’s unexpected success on the field was led by Kliff Kingsbury’s offense, featuring Offensive Rookie of the Year, Jayden Daniels. The Commanders’ offense ranked second in the NFL in percentage of drives ending in a score, fourth in EPA/play, fifth in points scored (regular season), and seventh in total yards and, while giving away the eighth fewest turnovers.
While the offense ranked near the top of the league in most categories, the defense was more uneven.
How you rate the passing defense might depend on which stats you prioritize. The Commanders ranked third in total yards allowed – although a lot of that was due to facing the second fewest passing attempts. They ranked 10th in net yards/attempt and 15th in TDs surrendered, while generating the 7th fewest interceptions. While production and productivity stats had the passing defense mostly in the top half of the league, efficiency stats told a somewhat different story. The Commanders’ passing defense ranked 13th in opponent Success Rate in the regular season, and 22nd in EPA/play.
The Commanders’ biggest weakness on defense was stopping the run. Part of that was due to facing the eight most rushing attempts. But who could fault opposing offenses for testing the Commanders’ rush defense, which gave up 4.8 yards per attempt, the fifth highest average in the league? As a result, the defense gave up the third highest rushing total in the regular season and ranked 24th in the league in opponent’s rushing success rate and 27th in EPA/play on running downs.
While much of the offseason discussion has focussed on the need to replace the pass rush production that left with Dante Fowler, the Commanders biggest weakness overall in 2024 was stopping the run. And it is not yet clear whether enough was done to shore up the rushing defense to prevent a repeat in 2025.
This four part series, will take a deep dive into the Commanders’ 2024 run defense stats to see what the numbers can tell us about areas for improvement, and examine the offseason moves to get a better idea of the outlook for the upcoming season.
I will kick things off by having a look at where opposing offenses had the most success running against the Commanders.
Run Direction Data
This article uses the same approach as my piece on the Commanders’ rushing attack in the leadup to the draft. I used PFF run direction data, which breaks down running success by offensive line gap for each individual player in every game. This allowed me to isolate rushing performance of running backs from quarterbacks.
QBs were excluded from this analysis because they are fundamentally different. Running QBs have higher average gains than RBs in large part because of their ability to run from passing sets, against passing defenses. Running backs can do that too, on RPO’s, but it is the smaller part of their game. In order to understand the Commanders’ rushing defense, I felt it was necessary to exclude runs by QBs.
Just in case anyone is worried that excluding QBs is distorting the picture, opposing QBs accounted for just 380 of 2,868 yds (13.2%) surrendered by Washington in 2024. In fact, the Commanders were better at defending against QBs than RBs. Opposing QBs averaged just 3.76 Y/A vs 5.16 Y/A for non-QBs, who were predominantly RBs.
PFF’s run direction terminology is illustrated in this figure:
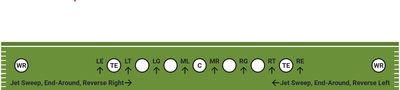
The A gaps are designated Middle Left (ML) and Middle Right (MR). The B gaps are Left Guard (LG) and Right Guard (RG). And the C gaps are Left Tackle (LT) and Right Tackle (RT). Runs outside the tight end are Left End (LE) and Right End (RE). Jet sweeps, end-arounds and reverses are counted separately on their respective sides, and are lumped together as JS-L and JS-R.
Where Were RBs Most Successful?
Total Yardage
The first graph shows total rushing yards by opposing RBs and other non-QBs, broken down by run direction, for all 20 games in the 2024 season:
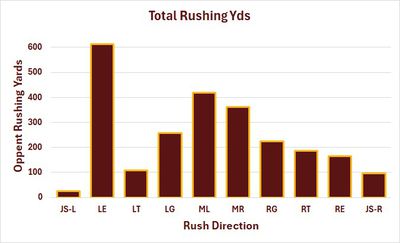
Notice anything about these data? Yeah, one gap clearly stands out from the rest.
The Commanders gave up the most total yards around the Left End (LE) of opponents’ lines, which faces the right end of the defensive line. Opposing offenses keyed on this gap, running the second most rushing attempts through it (77 att). Only the left A gap (ML) received more attention, and not by much at 83 attempts. The right A gap (MR) was the third most targeted, at 68 attempts.
The least utilized offensive line gap was the immediately adjacent C gap (LT, 31 att), followed by the opposite C gap (RT, 40 att). The Commanders faced small numbers of jet sweeps and other outside runs (JS-L 3 att; JS-R 8 att) but, as we will see, they could be very effective.
Rushing Average
The second graph shows the average yardage per attempt of non-QB runs by run direction:
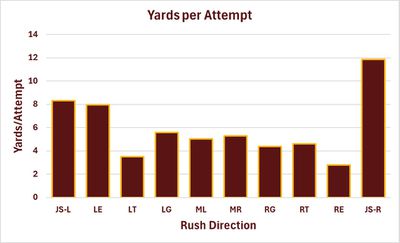
Adjusting the yardage figures by numbers of attempts gives a bit more insight into where the weak spots were, but the overall picture remains somewhat similar.
The reason that offenses focussed attention on the LE gap is because that’s where they had the most success. Rushes around the left end averaged 7.95 Y/A against the Commanders. The only runs that were more successful were jet sweeps and other outside runs. However, caution is required when interpreting those figures because of the small sample sizes. The 11.9 Y/A average on the right side (JS-R) is inflated by a single 61 yd run by WR Jameson Williams in the divisional playoff against the Lions. Taking that single play away drops the JS-R average to a nearly respectable 4.9 Y/A. So it is probably not indicative of a particular weakness of the Commanders’ defense.
After the left edge, offenses had the next most success through the left B gap (LG, 5.59 Y/A), right A gap (MR, 5.31 Y/A), and left A gap (ML, 5.04 Y/A).
Opposing teams had the least success running around the right end (RE, 2.80 Y/A) and the left C gap (LT, 3.52 Y/A).
Yardage Before Contact
The final figure shows opposing non-QBs’ Yardage Before Contact per Rushing Attempt (YBC/att). Yardage before contact, reflects a combination of run blocking and RB elusiveness, and is finding increasing use as a metric for run blocking, despite being somewhat indirect. It is even better for the present purpose, because it provides a direct measure of how quickly the defense got to the runner.
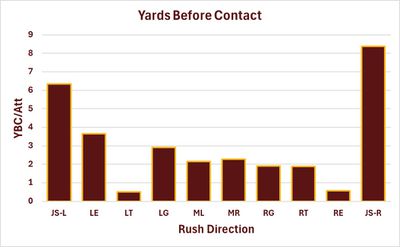
Yards before contact tells a similar story to yards per attempt. That is not unexpected, since the two figures are related. Yards before contact is a component of total yardage gained on each rushing attempt. It could be argued that yardage before contact provided the clearest indication of where the strengths and weaknesses of the run defense lie.
Starting with the strengths, the Commanders’ run defense was great at getting to runners coming through the left C gap (LT, 0.5 YBC/Att) and around the right end (RE, 0.58 YBC/Att). They were not as good at getting to runners along any of the interior gaps or the right C gap (RT). And they were particularly bad at stopping runners coming through the left B gap (LG, 2.91 YBC/Att) and around the left end (LE, 3.65 YBC/Att).
Runners who made it around either edge found a lot of room to run before the Commanders made first contact, on average. However, such runs were just a small fraction of the rushing attempts the Commanders faced.
Conclusions
Analysis of opponents’ 2024 rushing yardage by OL gap revealed the following:
The Commanders had a weakness at stopping the run around the left end of the offensive formation (right side of the DL) which opponents exploited for disproportionate yardage gains.
- The defense did not hold opposing runners to less than four yards per carry through any of the interior gaps. The run defense was particularly weak through the left B gap (LG, 5.59 Y/A allowed), the A gaps on either side of center (MR, 5.31 Y/A, ML 5.04 Y/A).
- The defense was particularly strong at making contact early on runs through the left C gap (LT, 0.52 YBC/Att) and around the right end (RE, 0.58 YBC/Att) resulting in the lowest opponent rushing averages (LT 3.52 Y/A, RE 2.80 Y/A).
- Runners who made it around either edge found plenty of running space and achieved high average gains. However, such runs represented a small fraction of opponents’ rushing attempts and the averages were subject to inflation by single long runs.
Overall, the results point to a particular weakness in setting the edge along the right side of the defensive line, and along the right interior and centre of the DL, with the lone exception of runs through opponents’ left C gaps. The run defense was a little better on the left side of the DL, and was particularly strong against runs around opponents’ right ends, which was defended by the left defensive end.